
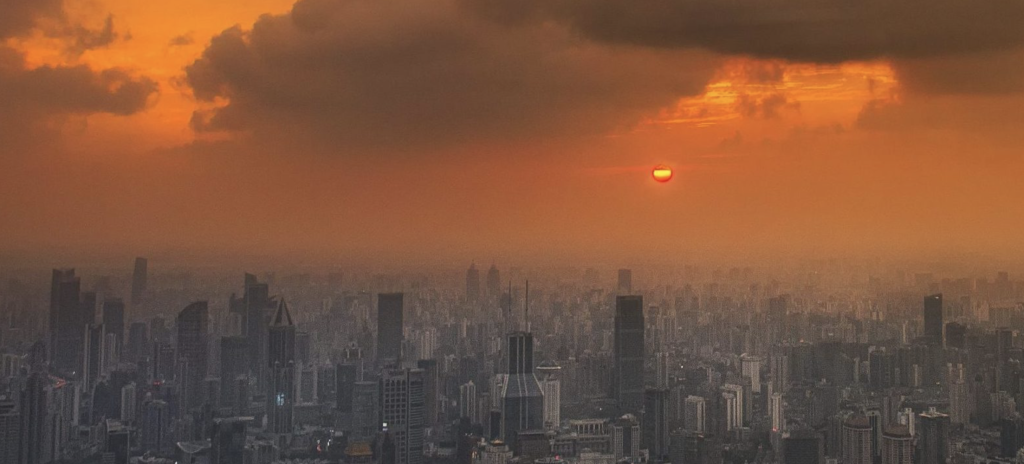
Here’s a small mystery, the sort that hides in plain sight until some fact stops the observer cold on the sidewalk: heat, unlike almost every other catastrophe on offer at present, does not announce itself. A hurricane has the decency to spin on the weather map for a week before it arrives, like a guest who calls ahead. A flood leaves a plain brown line on the wall to mark how high it got. But heat — heat just moves in. It comes through the roof at two in the afternoon and it is still there at two in the morning, sitting on the chest of an old man three flights up, and by the time anyone notices, the thing has already been and gone, and what’s left is a body and a death certificate that says something else — heart, usually, or “natural causes,” that catchall phrase reached for when no one much wants to name the actual assailant.
This is worth pausing over not for the sake of morbidity but because the politeness of the thing is exactly what makes it hard to see straight. People are pattern-seeking creatures, wired up to watch for smoke and listen for the siren, and heat gives them neither. One would think, given how much is now known about it, that the seeing would have gotten easier. It has not, particularly. What has gotten easier is the measuring of it after the fact, which is its own kind of comfort — the comfort of the coroner’s report: at least now a number can be put on the thing that did the damage.
Unacceptable.
BACKGROUND INFO:
- Global population, 2026: ~8.3 billion
- Urban share: ~58%, so roughly 4.8 billion people live in urban areas
- Baseline annual heat deaths (recent multi-year average): ~546,000
- If deaths were distributed exactly by population share, urban areas alone would account for ~58% of 546,000 ≈ 317,000 deaths/year
- But urban heat islands add extra risk on top of population share — hotter nights, less green cover, denser informal housing — so the real urban share is almost certainly higher than a flat population split, plausibly in the 60–65% range
- 2024–2026 have run hotter than the 2012–2021 baseline period, so the true current-year total is likely above the 546,000 average, not below it
The Diagnosis, and Why It’s Not What Anyone Would Guess
Ask the average citizen what should be done about a hot city and a confident answer will come back fast, because heat is one of the few disasters that makes everyone an instant expert. Plant the trees. Paint the roofs white. Put in air conditioning, and be done with it. All fine answers. All, individually, about as useful as a single aspirin against a fever with four separate causes.
Because that’s the thing nobody tells the citizen about a heat-sick city: it isn’t sick from one thing. It’s sick from four or five things at once, each showing up on a different system — the roof is bad, and the ventilation is bad, and there’s no shade on the street, and nobody checks on the old woman on the third floor during the bad week in July, and the city council hasn’t gotten around to writing any of this into the building code. Treat the roof and ignore the ventilation, and the patient still runs hot at night, when it matters most. Plant the trees and skip the governance, and in five years the trees are dead from neglect and the whole cycle starts again. It is, in other words, a case that calls for a workup, not a prescription — the whole history taken before the symptom is treated, and pity the physician who reaches for one pill and calls it a day.
The good news, if there is any in this line of work, is that the workup has been done, more or less, in enough cities now to know what it shows: the symptoms cluster, and they respond together or not at all. A city that bothers to map its own fever — meaning it actually surveys who is hot and where — turns out to be, by a wide and rather startling margin, more likely to have already started treating it. Which tells something a little uncomfortable about the nature of the sickness: it isn’t a shortage of remedies. It’s a shortage of looking.
The Part of Town Where the Fever Runs Highest
Here is the part of the case history worth sitting with a while, the part most people skip past on the way to the funding request. Heat, it turns out, is not a democrat. It does not fall equally on the just and the unjust, the rich ward and the poor one. It pools, the way water pools, in the low places — and the low places, in a city, are not a matter of elevation but of income. The tin roof with no insulation belongs to the family that couldn’t afford the other kind. The block with no trees is the block where nobody with the money to plant one ever lived. A man in a leafy suburb and a woman in an informal settlement two miles off are standing, at that very moment, under two entirely different climates, though the thermometer at the airport reports one temperature for the whole metropolitan area, as if that meant anything at all.
This should trouble more people than it does. A twelve-city study — conducted, appropriately enough, by people whose job is counting such things — found that the money lost each year to heat-stricken labor already runs to tens of billions of dollars, on track to roughly double within a few decades, and that this loss is not spread evenly across the population like a tax but concentrated, like a bruise, on the outdoor worker, the informal trader, the garment presser in the sweltering global South whose city loses a share of its whole economic output many times greater than the air-conditioned capitals of the North ever will. (Atlantic Council / Climate Resilience Center, Hot Cities, Chilled Economies) The districts that run hottest and the districts that can least afford to run hot turn out, with a consistency that ought to embarrass everyone involved, to be the same districts.
In Defense of the Tree, Against the Category of “Nice to Have”
A word is owed here to the tree, and the park, and the small wet ditch called a rain garden, because these things keep getting filed under Nice to Have, right there next to the fountain in the lobby and the mural on the parking garage, when in fact they belong in a different file altogether, the one marked Load-Bearing. A tree does not decorate a street. It cools it, by a measurable amount, while also cleaning the air, slowing the runoff, and giving some sparrow a place to live, all from one hole dug in the ground one time. There is no other line item in a municipal budget that does four jobs from a single entry — which makes the habit of cutting it first, when money runs short, a small monument to bad accounting.
The Remedy That Costs Nothing, Which Is Precisely Why It Gets Distrusted
There’s a tier of treatment in this business that costs not one red cent, and it is, by most accounts, chronically undersold, on the peculiar theory that a remedy this cheap can’t be doing much. Teaching a household when to open the window and when to shut it. Walking a neighborhood block by block to find out, from the people who live there, exactly where the heat collects. Setting up a rotation so somebody checks on the old folks during the bad stretch. None of this requires a bond issue. All of it requires the one resource that turns out to be scarcer than money in most poor neighborhoods, which is organized attention — somebody whose job, paid or not, is to notice and to act on the noticing. Poverty limits what a family can buy. It does not, as it happens, limit what a block can know about itself, or teach itself, once somebody bothers to ask.
The Rules That Outlive the Person Who Wrote Them
None of this scales, of course, without the least interesting ingredient of all: the rule that keeps working after the enthusiasm that wrote it has moved on to some other cause. A single retrofitted rooftop is a nice story for the newsletter. A building code that requires the retrofit on every new roof from here on is a fact of the city, indifferent to whether anyone remembers the pilot program that inspired it. This is, on reflection, the whole difference between a project and an institution — a project depends on somebody’s memory; an institution runs on its own, the way a good habit runs on its own long after the willpower that started it has quietly left the building.
The Only Question Left
Not “how does a city cool itself” — that part of the file is by now embarrassingly thick with answers, most of them known, tested, and gathering dust. The real question, the one that actually determines who lives through July and who doesn’t, is this: who gets treated first, with whose money, decided in whose office. A city that starts its treatment in its hottest, poorest ward — with the free remedies, the ones that require nothing but somebody willing to knock on doors — will do more good, faster, than a city that starts in the leafy neighborhood that was never really sick to begin with. Heat does not check the balance in anyone’s account before it comes in through the roof. It would be a fine thing, for once, if the treatment of it didn’t check the balance either.
The Cooling Cities App
The research on urban heat is not scarce. Webinars, journal papers, city case studies, twelve-city economic-loss reports — the evidence base is deep, and getting deeper every summer. Most of what exists on urban cooling is written for one of two audiences — researchers building the evidence base, or well-funded cities with a dedicated sustainability office to interpret it — and almost none of it is built for the practitioner standing in a resource-constrained neighborhood asking a much smaller, much more urgent question: what do we actually do, starting now, with what we have. That’s the purpose of the Cooling Cities app >>
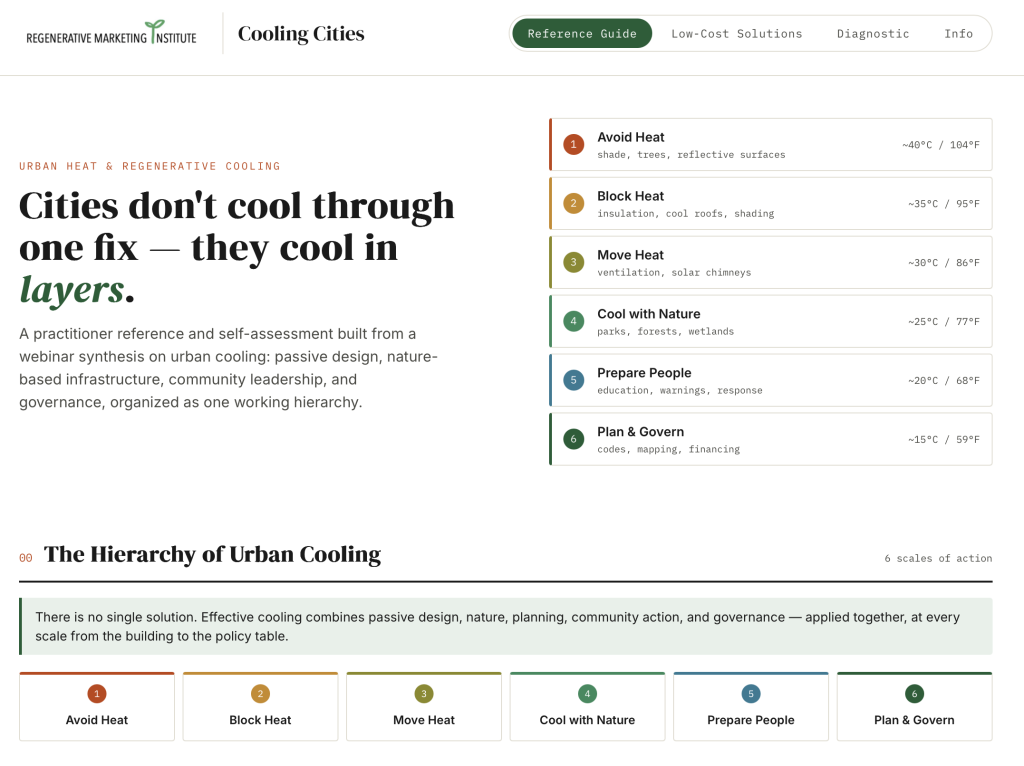
We built the Cooling Cities app to close this gap, for three reasons in particular.
The hierarchy gets flattened into a menu. Cooling strategies are usually presented as an undifferentiated list — plant trees, paint roofs, build codes — with no sense of how the pieces depend on each other or where a given city should actually start. Treating a genuine sequence as a menu leads cities to pick the most visible or fundable item rather than the most needed one. Structuring it as a hierarchy was the whole point: it forces the question of what comes first here, not just what’s available.
Equity kept getting treated as a footnote. Most cooling guidance defaults to solutions that assume a working budget — cool-roof subsidies, retrofit grants, infrastructure bonds — and mentions low-cost, informal-settlement-appropriate options, if at all, as an afterthought at the bottom of the page. The neighborhoods facing the worst heat exposure are disproportionately the ones with the least capital to spend on it, so a tool that buries the low-cost tier is a tool that quietly deprioritizes the people who need it most. Giving it a dedicated section, on equal footing with everything else, was a deliberate correction.
Nobody had a way to check their own position. Reading a good reference guide tells you what’s possible. It doesn’t tell you where you stand. The diagnostic exists because the actual bottleneck for most cities and neighborhoods isn’t a lack of good ideas — it’s not knowing, with any precision, which layer is already strong and which is missing entirely. A city that can name its weakest layer has a next step. A city that only has the full menu in front of it usually doesn’t.
The underlying purpose is a simple one: that a free, ungated tool which makes the priority order visible — and treats the zero-cost, community-led tier as seriously as the capital-intensive one — will get more cities moving faster than another comprehensive report that ends in a recommendation to consult further with stakeholders.
Try it, share it.
And let us know what you think.